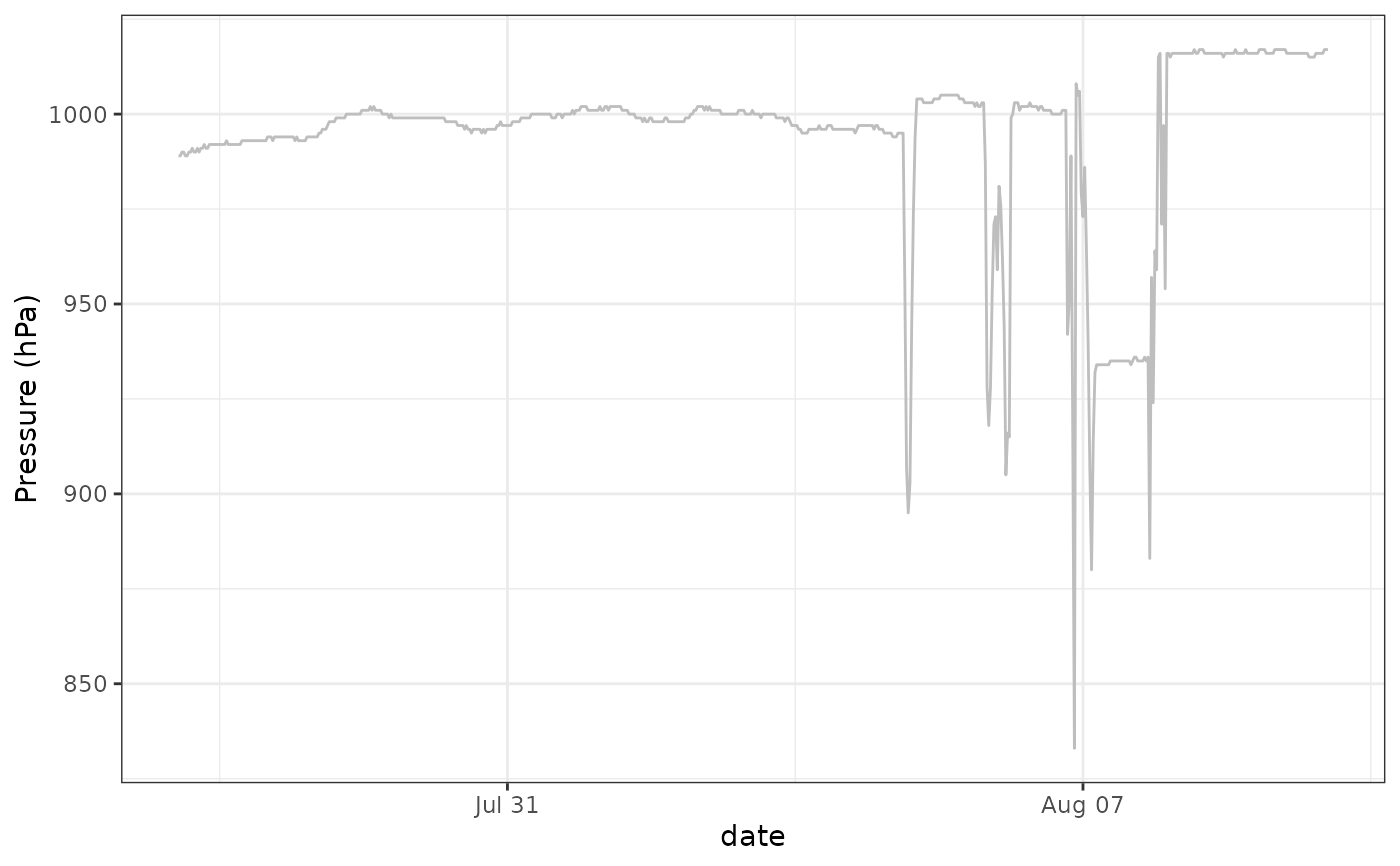
This function display a plot of pressure time series recorded by a tag
Examples
withr::with_dir(system.file("extdata", package = "GeoPressureR"), {
tag <- tag_create("18LX", quiet = TRUE)
})
plot_tag_pressure(tag, plot_plotly = FALSE)
 withr::with_dir(system.file("extdata", package = "GeoPressureR"), {
tag <- tag_label(tag, quiet = TRUE)
})
plot_tag_pressure(tag)
withr::with_dir(system.file("extdata", package = "GeoPressureR"), {
tag <- tag_label(tag, quiet = TRUE)
})
plot_tag_pressure(tag)