Creates visualizations for a GeoLocator Data Package, including coverage plots showing data availability across time for different sensors and tags.
Usage
# S3 method for class 'geolocatordp'
plot(x, type = NULL, ...)Examples
pkg <- read_zenodo("17367319")
#> Warning: Selecting ‘env’ backend. Secrets are stored in environment variables
#> ℹ Retrieve Zenodo record 17367319
#> Warning: Selecting ‘env’ backend. Secrets are stored in environment variables
#> ✔ Retrieve Zenodo record 17367319 [706ms]
#>
#> ℹ Download files from Zenodo
#> Warning: Selecting ‘env’ backend. Secrets are stored in environment variables
#> ✔ Download files from Zenodo [2.9s]
#>
#> ℹ Read and upgrade GeoLocator-DP
#> ✔ Upgrading GeoLocator-DP from "main" to "v1.0".
#> ℹ Read and upgrade GeoLocator-DP
#> ✔ Read and upgrade GeoLocator-DP [548ms]
#>
#> ℹ Add metadata
#> ✔ Add metadata [93ms]
#>
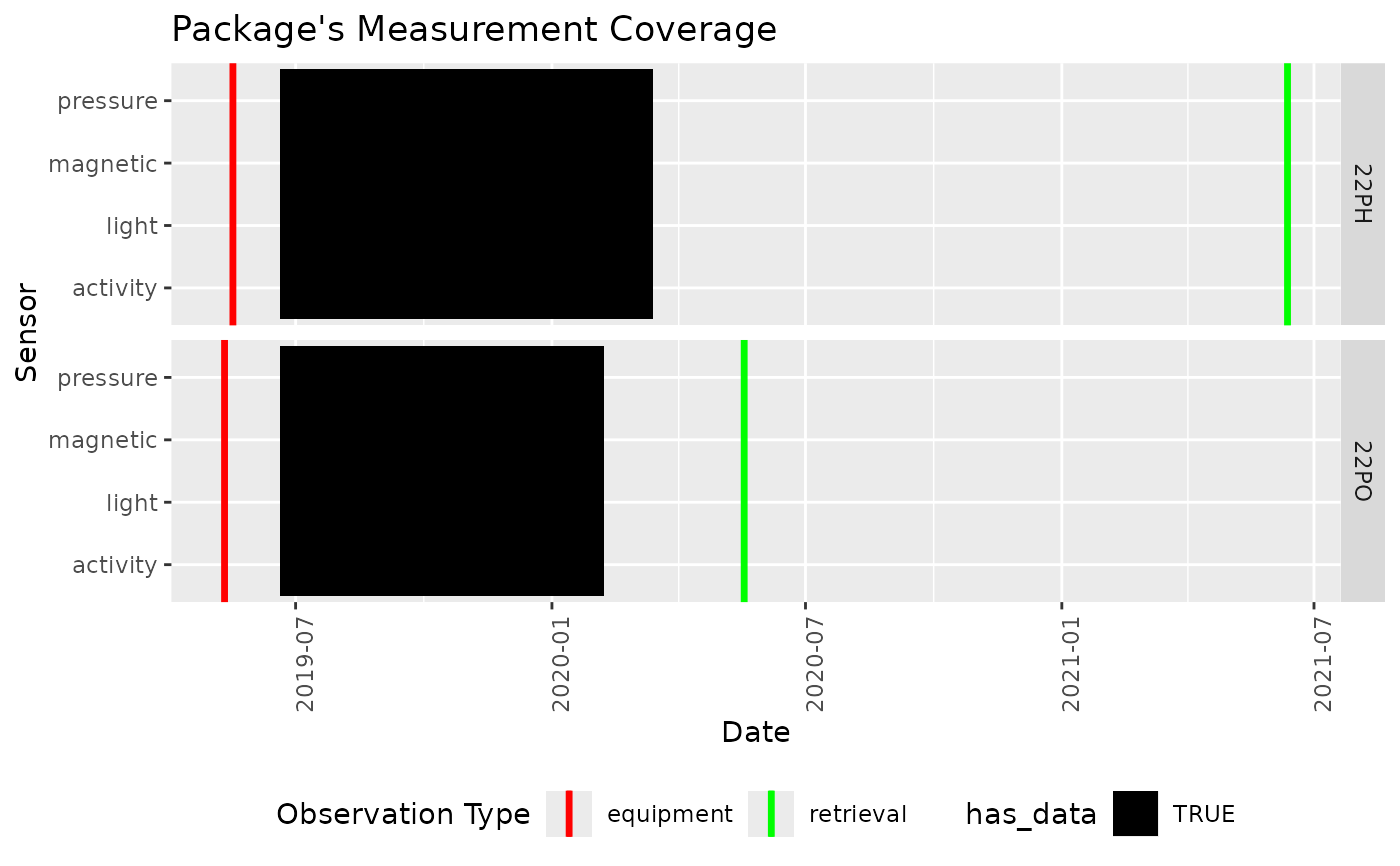
# Plot data coverage
plot(pkg, type = "coverage")
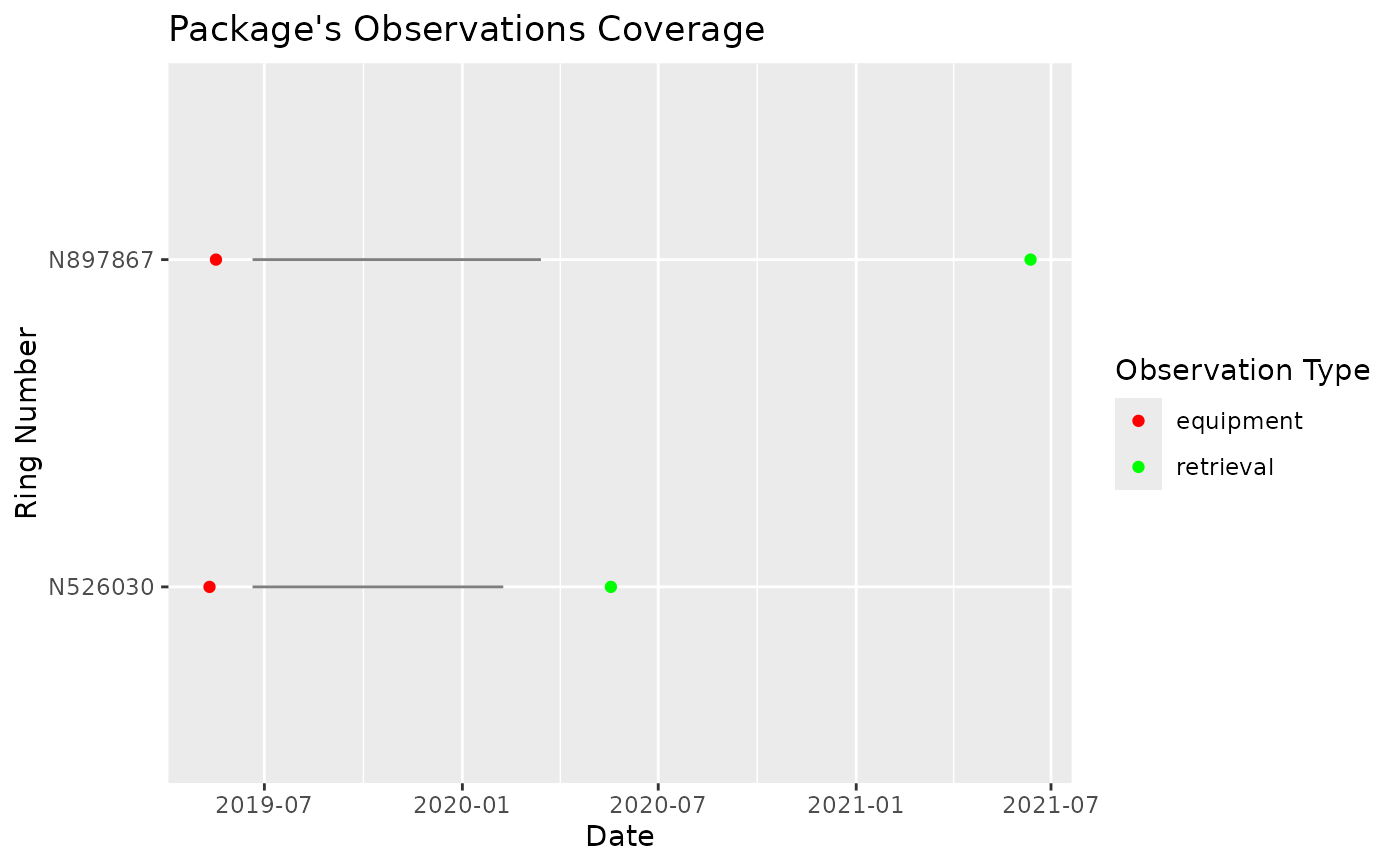
 # Plot observation history by ring
plot(pkg, type = "ring")
# Plot observation history by ring
plot(pkg, type = "ring")
 # Plot map view
plot(pkg, type = "map")
# Plot map view
plot(pkg, type = "map")