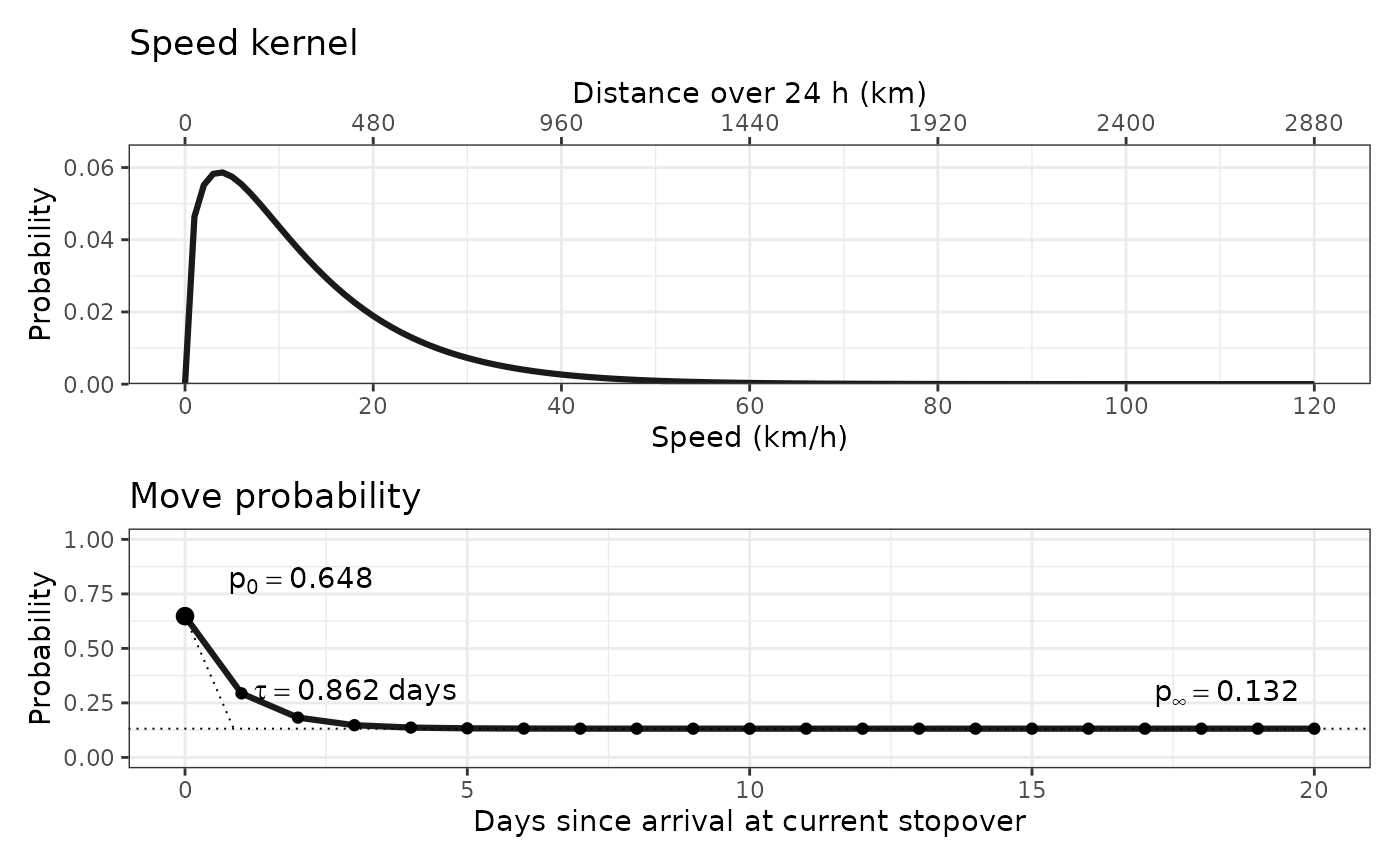
Plot the speed kernel and residence-dependent probability of movement for a
sampling_path() movement specification.
Arguments
- movement
movement list passed to
sampling_path(), such assampling_path_default_movement().- speed
speed values in km/h used to evaluate the movement kernel.
- stay_duration
residence durations in days used to evaluate
movement$move_stay.
Value
A patchwork plot with speed and move/stay panels. When
movement$move_stay_parameters contains p_0, p_inf, and tau, the
move/stay panel marks those parameters for the exponential-decay-to-plateau
model.
See also
Other sampling_path:
sampling_path(),
sampling_path_default_movement(),
sampling_path_diagnostic()
Examples
plot_movement(sampling_path_default_movement())
#> Registered S3 method overwritten by 'GeoPressureR':
#>   method    from
#>   print.tag pkgdown