
This function returns ground elevation along a path from precomputed statistics of the Copernicus DEM GLO-90 (90 m): the minimum, the 10th to 90th percentiles and the maximum of the DEM pixels within each grid cell. These statistics describe the range of terrain elevation the bird can fly over within a cell.
The statistics are computed by
data-raw/ground_elevation.R
on the map grids of tag_set_map() (scale 1, 2, 4, 5 and 10) and published as the
ground-elevation-v1 release.
The file of the requested scale (0.4 MB for scale = 1, 6 MB for 4, 9 MB for 5, 33 MB
for 10) is downloaded once on first use and cached in tools::R_user_dir("GeoPressureR", "cache"); later calls are local.
Consecutive path positions are connected by great-circle segments. Each segment is sampled
from its start at a fixed distance interval controlled by sampling_scale, and the last
position is added. Each sample reads the requested statistics of the grid cell containing it.
Missing positions between known positions are interpolated separately in longitude and latitude using cumulative flight duration from start and end. Missing positions before the first or after the last known position are excluded with a warning.
The result is a spatial profile without timestamps. Its fractional stap_id values describe distance along each segment, whereas find_stap() uses elapsed flight time. Interpolating elevation onto a pressure path using stap_id therefore assumes constant speed along each segment.
Elevation is rounded to whole metres above the EGM2008 geoid. Sea is 0, and coastal cells
include sea pixels as ground the bird can fly over.
Usage
path2elevation(
  path,
  scale = 4,
  sampling_scale = scale,
  percentile = c(10, 50, 90),
  debug = FALSE
)
Arguments
- path
A GeoPressureR
pathdata.frame withlon,lat,stap_id,start, andendcolumns. Coordinates are in degrees, times are POSIXct, andstap_idis numbered1, ..., nrow(path)in chronological order.- scale
Elevation grid resolution in pixels per degree (e.g.,
4corresponds to0.25°), matchingscaleoftag_set_map()so that cells coincide with the map grid. The finest available grid not coarser thanscaleis used among1, 2, 4, 5, 10(e.g.,3uses4), and10above it.- sampling_scale
Sampling density along each path segment, with a distance interval of
111139 / sampling_scalemetres (about 27.8 km for4). Defaults toscale; increasing it adds samples without changing the elevation grid resolution.- percentile
Elevation percentiles to retrieve within each grid cell, among
0, 10, 20, ..., 90, 100;0is the minimum,50the median and100the maximum.- debug
logical to display additional information, such as the elevation file used.
Value
A data.frame containing
stap_idstationary-period ID plus the fraction of segment distance travelled toward the next position (e.g.,2.5is halfway from position 2 to 3)lon,latcentre of the grid cell read, in degrees, rounded to three decimal places; these differ from the exact positions on the polylinedistancecumulative geodesic (WGS84) distance in km from the first retained path positionX<percentile>ground elevation in metres for each requested percentile (e.g.,X10,X50, andX90by default)
See also
Other path:
path2edge(),
path2twilight(),
plot_path(),
tag2path()
Examples
# Create a path
path <- data.frame(
lon = c(8.47, 9.41, 9.01, -0.91, 14.24, 27.30, 34.39, 30.00),
lat = c(48.89, 44.78, 40.07, 37.68, 17.33, 7.32, 8.09, -23.13),
start = as.POSIXct(
c(
"2017-05-01 00:42", "2017-05-03 01:22", "2017-05-03 22:47", "2017-05-06 03:32",
"2017-05-07 01:12", "2017-05-07 22:32", "2017-05-09 21:52", "2017-05-10 21:12"
),
tz = "UTC"
),
end = as.POSIXct(
c(
"2017-05-02 22:12", "2017-05-03 20:12", "2017-05-06 02:47", "2017-05-06 23:22",
"2017-05-07 17:42", "2017-05-09 20:27", "2017-05-10 19:57", "2017-05-11 21:17"
),
tz = "UTC"
),
stap_id = seq(1, 8)
)
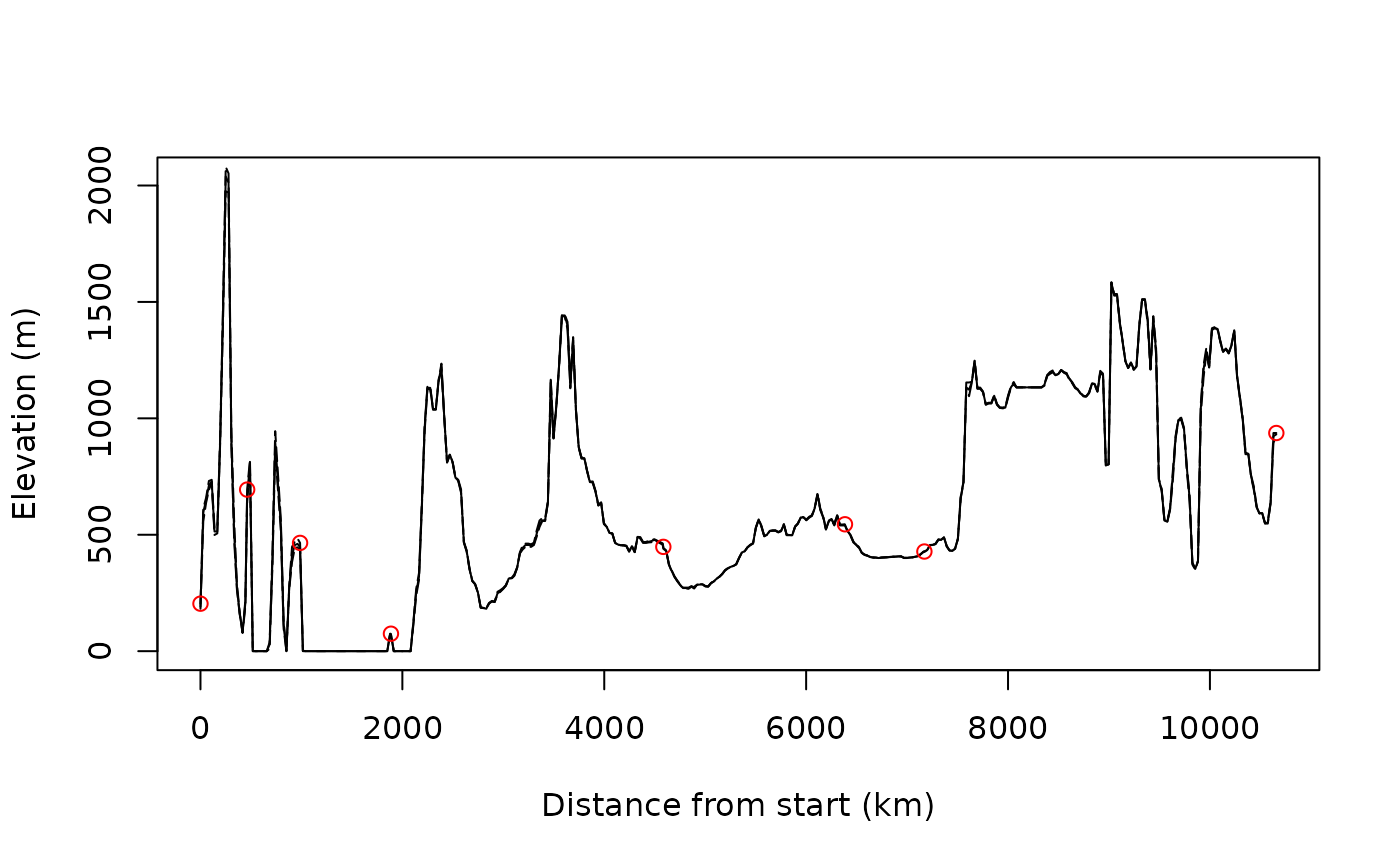
plot_path(path)
elevation <- path2elevation(path)
plot(elevation$distance, elevation$X50,
type = "l",
ylab = "Elevation (m)", xlab = "Distance from start (km)"
)
lines(elevation$distance, elevation$X10, lty = 5)
lines(elevation$distance, elevation$X90, lty = 5)
id <- elevation$stap_id %% 1 == 0
points(elevation$distance[id], elevation$X90[id], col = "red")
 # Starting from the most likely path and its pressurepath computed with `geopressuretemplate()`
withr::with_dir(system.file("extdata", package = "GeoPressureR"), {
path <- load_interim("18LX", var = "path_most_likely")
pressurepath <- load_interim("18LX", var = "pressurepath_most_likely")
})
elevation <- path2elevation(path)
# Map median ground elevation to pressure samples, assuming constant flight speed
pressurepath$ground_elevation <- stats::approx(
x = elevation$stap_id,
y = elevation$X50,
xout = pressurepath$stap_id
)$y
# Altitude above median ground level (metres)
pressurepath$altitude_agl <- pressurepath$altitude - pressurepath$ground_elevation