This function plots a path data.frame. This function is used in plot.map().
Usage
plot_path(
  path,
  plot_leaflet = TRUE,
  map = NULL,
  provider = "Esri.WorldTopoMap",
  provider_options = leaflet::providerTileOptions(),
  pad = 3,
  polyline = NULL,
  circle = NULL
)
Arguments
- path
a GeoPressureR
pathdata.frame.- plot_leaflet
logical defining if the plot is an interactive
leafletmap or a static basic plot.- map
optional
mapobject to plot the path on top of.- provider
tile provider name (see
leaflet::providers).- provider_options
tile options. See leaflet::addProviderTiles() and leaflet::providerTileOptions()
- pad
padding of the map in degree lat-lon (only for
plot_leaflet = FALSE).- polyline
list of parameters passed to
leaflet::addPolylines()- circle
list of parameters passed to
leaflet::addCircleMarkers()
See also
Other path:
path2edge(),
path2elevation(),
path2twilight(),
tag2path()
Examples
withr::with_dir(system.file("extdata", package = "GeoPressureR"), {
tag <- tag_create("18LX", quiet = TRUE) |>
tag_label(quiet = TRUE)
})
path <- data.frame(
stap_id = 1:4,
lon = c(17.05, 16.2, NA, 15.4),
lat = c(48.9, 47.8, NA, 46.5),
known_lon = c(17.05, NA, NA, NA),
known_lat = c(48.9, NA, NA, NA),
start = as.POSIXct(
c("2018-01-01", "2018-01-03", "2018-01-05", "2018-01-07"),
tz = "UTC"
),
end = as.POSIXct(
c("2018-01-02", "2018-01-04", "2018-01-06", "2018-01-08"),
tz = "UTC"
)
)
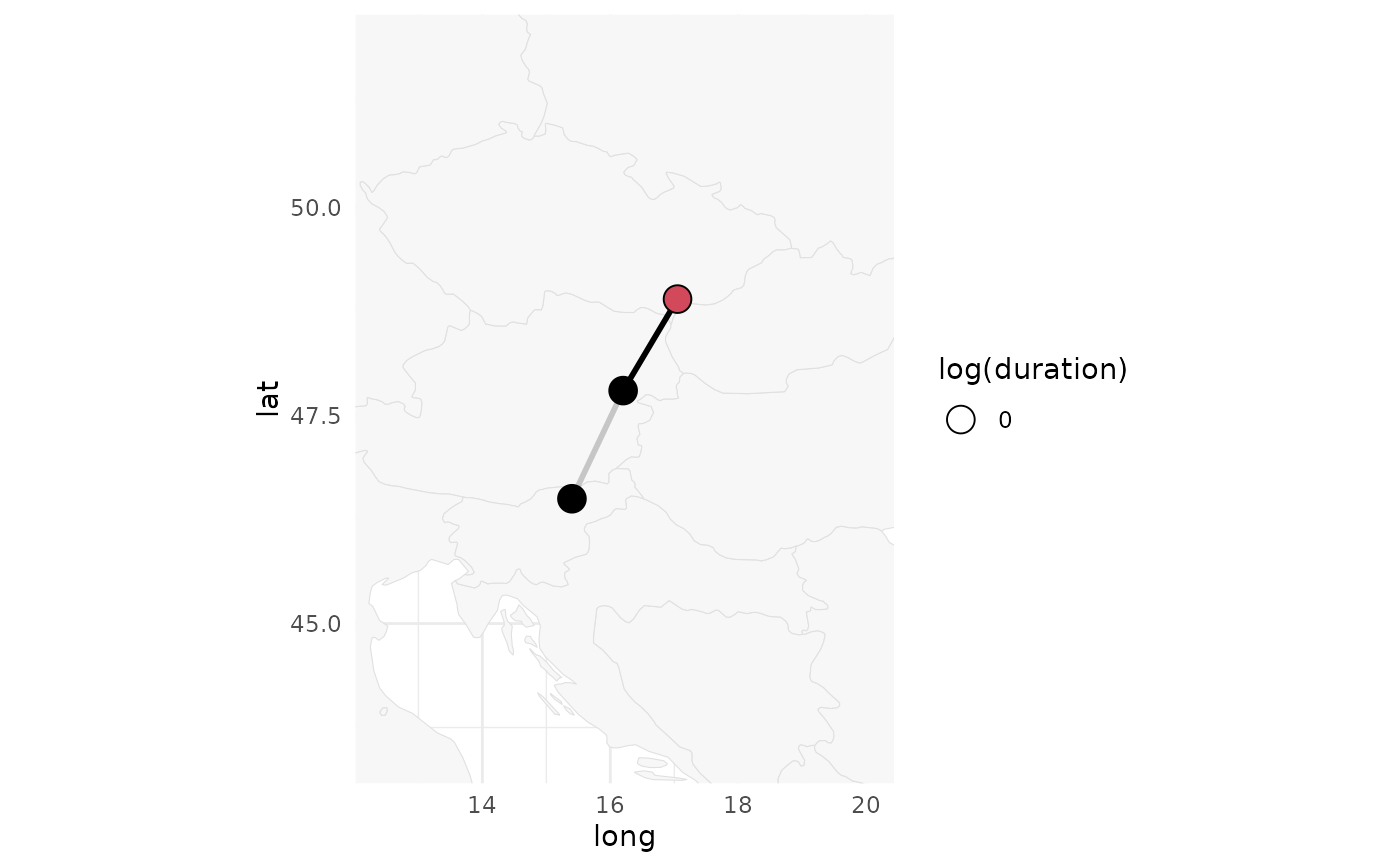
plot_path(path)
plot_path(path, plot_leaflet = FALSE)