This function plots a GeoPressureR map object.
You can plot on top of the map a path, this uses the plot_path() function.
Our maps are defined in lat-lon (i.e., EPSG:4326), but the display of maps on web map are
nearly always in web mercator (i.e.,
EPSG:3857). We therefore need to reproject our map for display.
However, we don't really want to interpolate the map as each pixel might be important to
visualize. We therefore re-project with a near-neighbour interpolation (method = "near"
in terra::project()). Yet to avoid having pixel misplaced, we generally need to use a
projection with a finer resolution. The argument fac_res_proj controls the relative change of
resolution between the original map to the projected map.
Usage
# S3 method for class 'map'
plot(
  x,
  path = NULL,
  thr_likelihood = 1,
  plot_leaflet = TRUE,
  provider = "Esri.WorldTopoMap",
  provider_options = leaflet::providerTileOptions(),
  palette = NULL,
  opacity = 0.8,
  legend = FALSE,
  fac_res_proj = 4,
  ...
)
Arguments
- x
a GeoPressureR
mapobject- path
a GeoPressureR
pathdata.frame- thr_likelihood
Threshold to display likelihood values.
- plot_leaflet
logical to use an interactive
leafletmap instead ofterra::plot- provider
tile provider name (see
leaflet::providers).- provider_options
tile options. See leaflet::addProviderTiles() and leaflet::providerTileOptions()
- palette
color palette name or vector of colors.
- opacity
opacity of the raster layer in leaflet.
- legend
logical to display the legend.
- fac_res_proj
Factor of the resolution of the reprojection (see details above). A value of
1will roughly reproject on a map with similar size resulting in relatively high inaccuracy of the pixel displayed. Increasing this factor will reduce the uncertainty but might also increase the computational cost of the reprojection.- ...
additional parameters passed to
leaflet::addRasterImage()orterra::plot().
Examples
withr::with_dir(system.file("extdata", package = "GeoPressureR"), {
tag <- tag_create("18LX", quiet = TRUE) |>
tag_label(quiet = TRUE) |>
tag_set_map(
extent = c(-16, 23, 0, 50),
scale = 4
) |>
geopressure_map(quiet = TRUE)
})
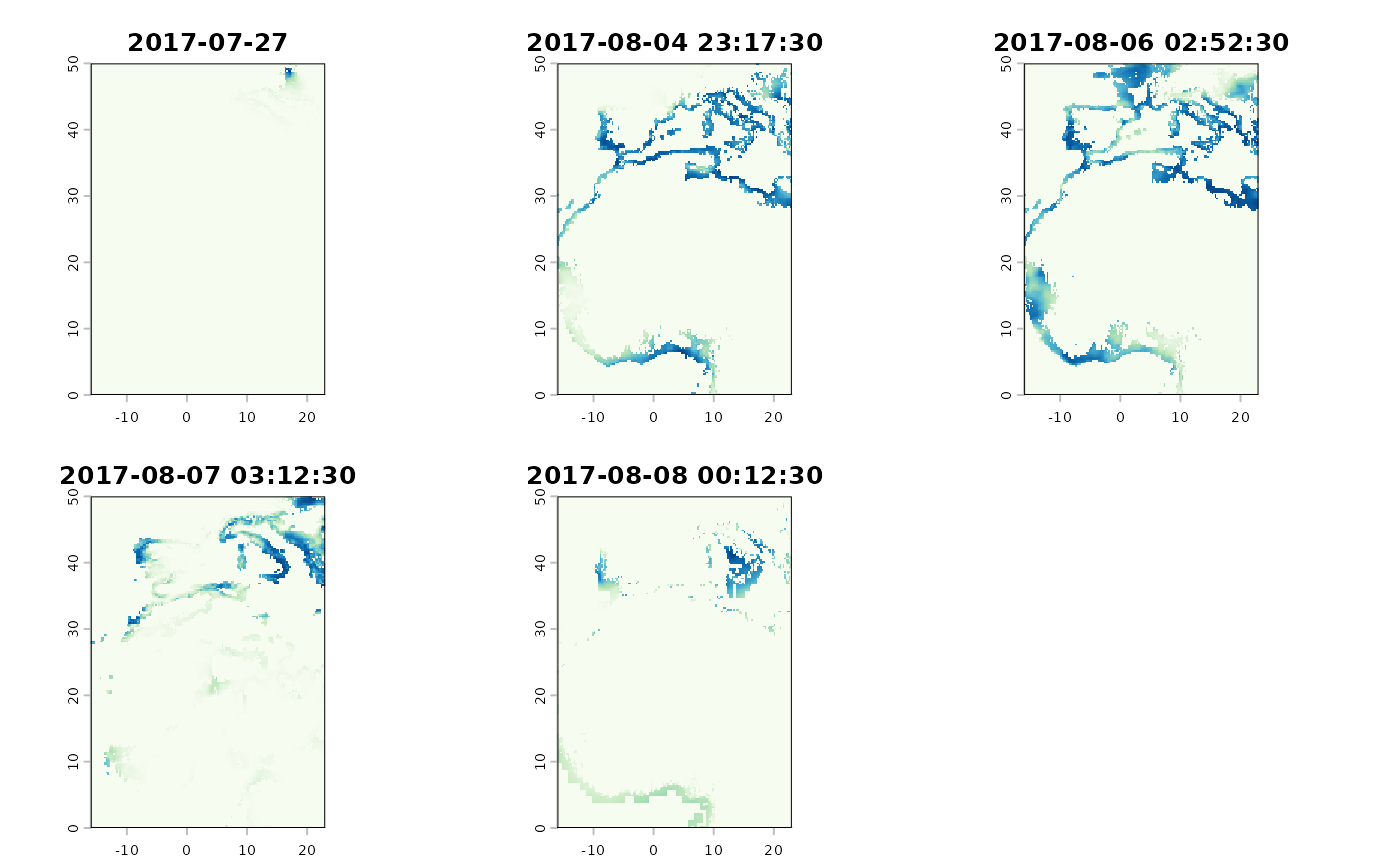
plot(tag$map_pressure)
plot(tag$map_pressure, plot_leaflet = FALSE)
 # `thr_likelihood` can be used to visualize its effect in `graph_create`
plot(tag$map_pressure,
thr_likelihood = 0.9,
palette = "viridis",
opacity = 1,
provider = "CartoDB.DarkMatterNoLabels"
)
# `thr_likelihood` can be used to visualize its effect in `graph_create`
plot(tag$map_pressure,
thr_likelihood = 0.9,
palette = "viridis",
opacity = 1,
provider = "CartoDB.DarkMatterNoLabels"
)