# install.packages("pak")
pak::pkg_install("GeoPressure/GeoPressureR")

# Development version:
pak::pkg_install("GeoPressure/GeoPressureR@dev")A User Manual for GeoPressureR
Learn how to use GeoPressureR with a Swainson’s Warbler and a Great Reed Warbler.
Introduction
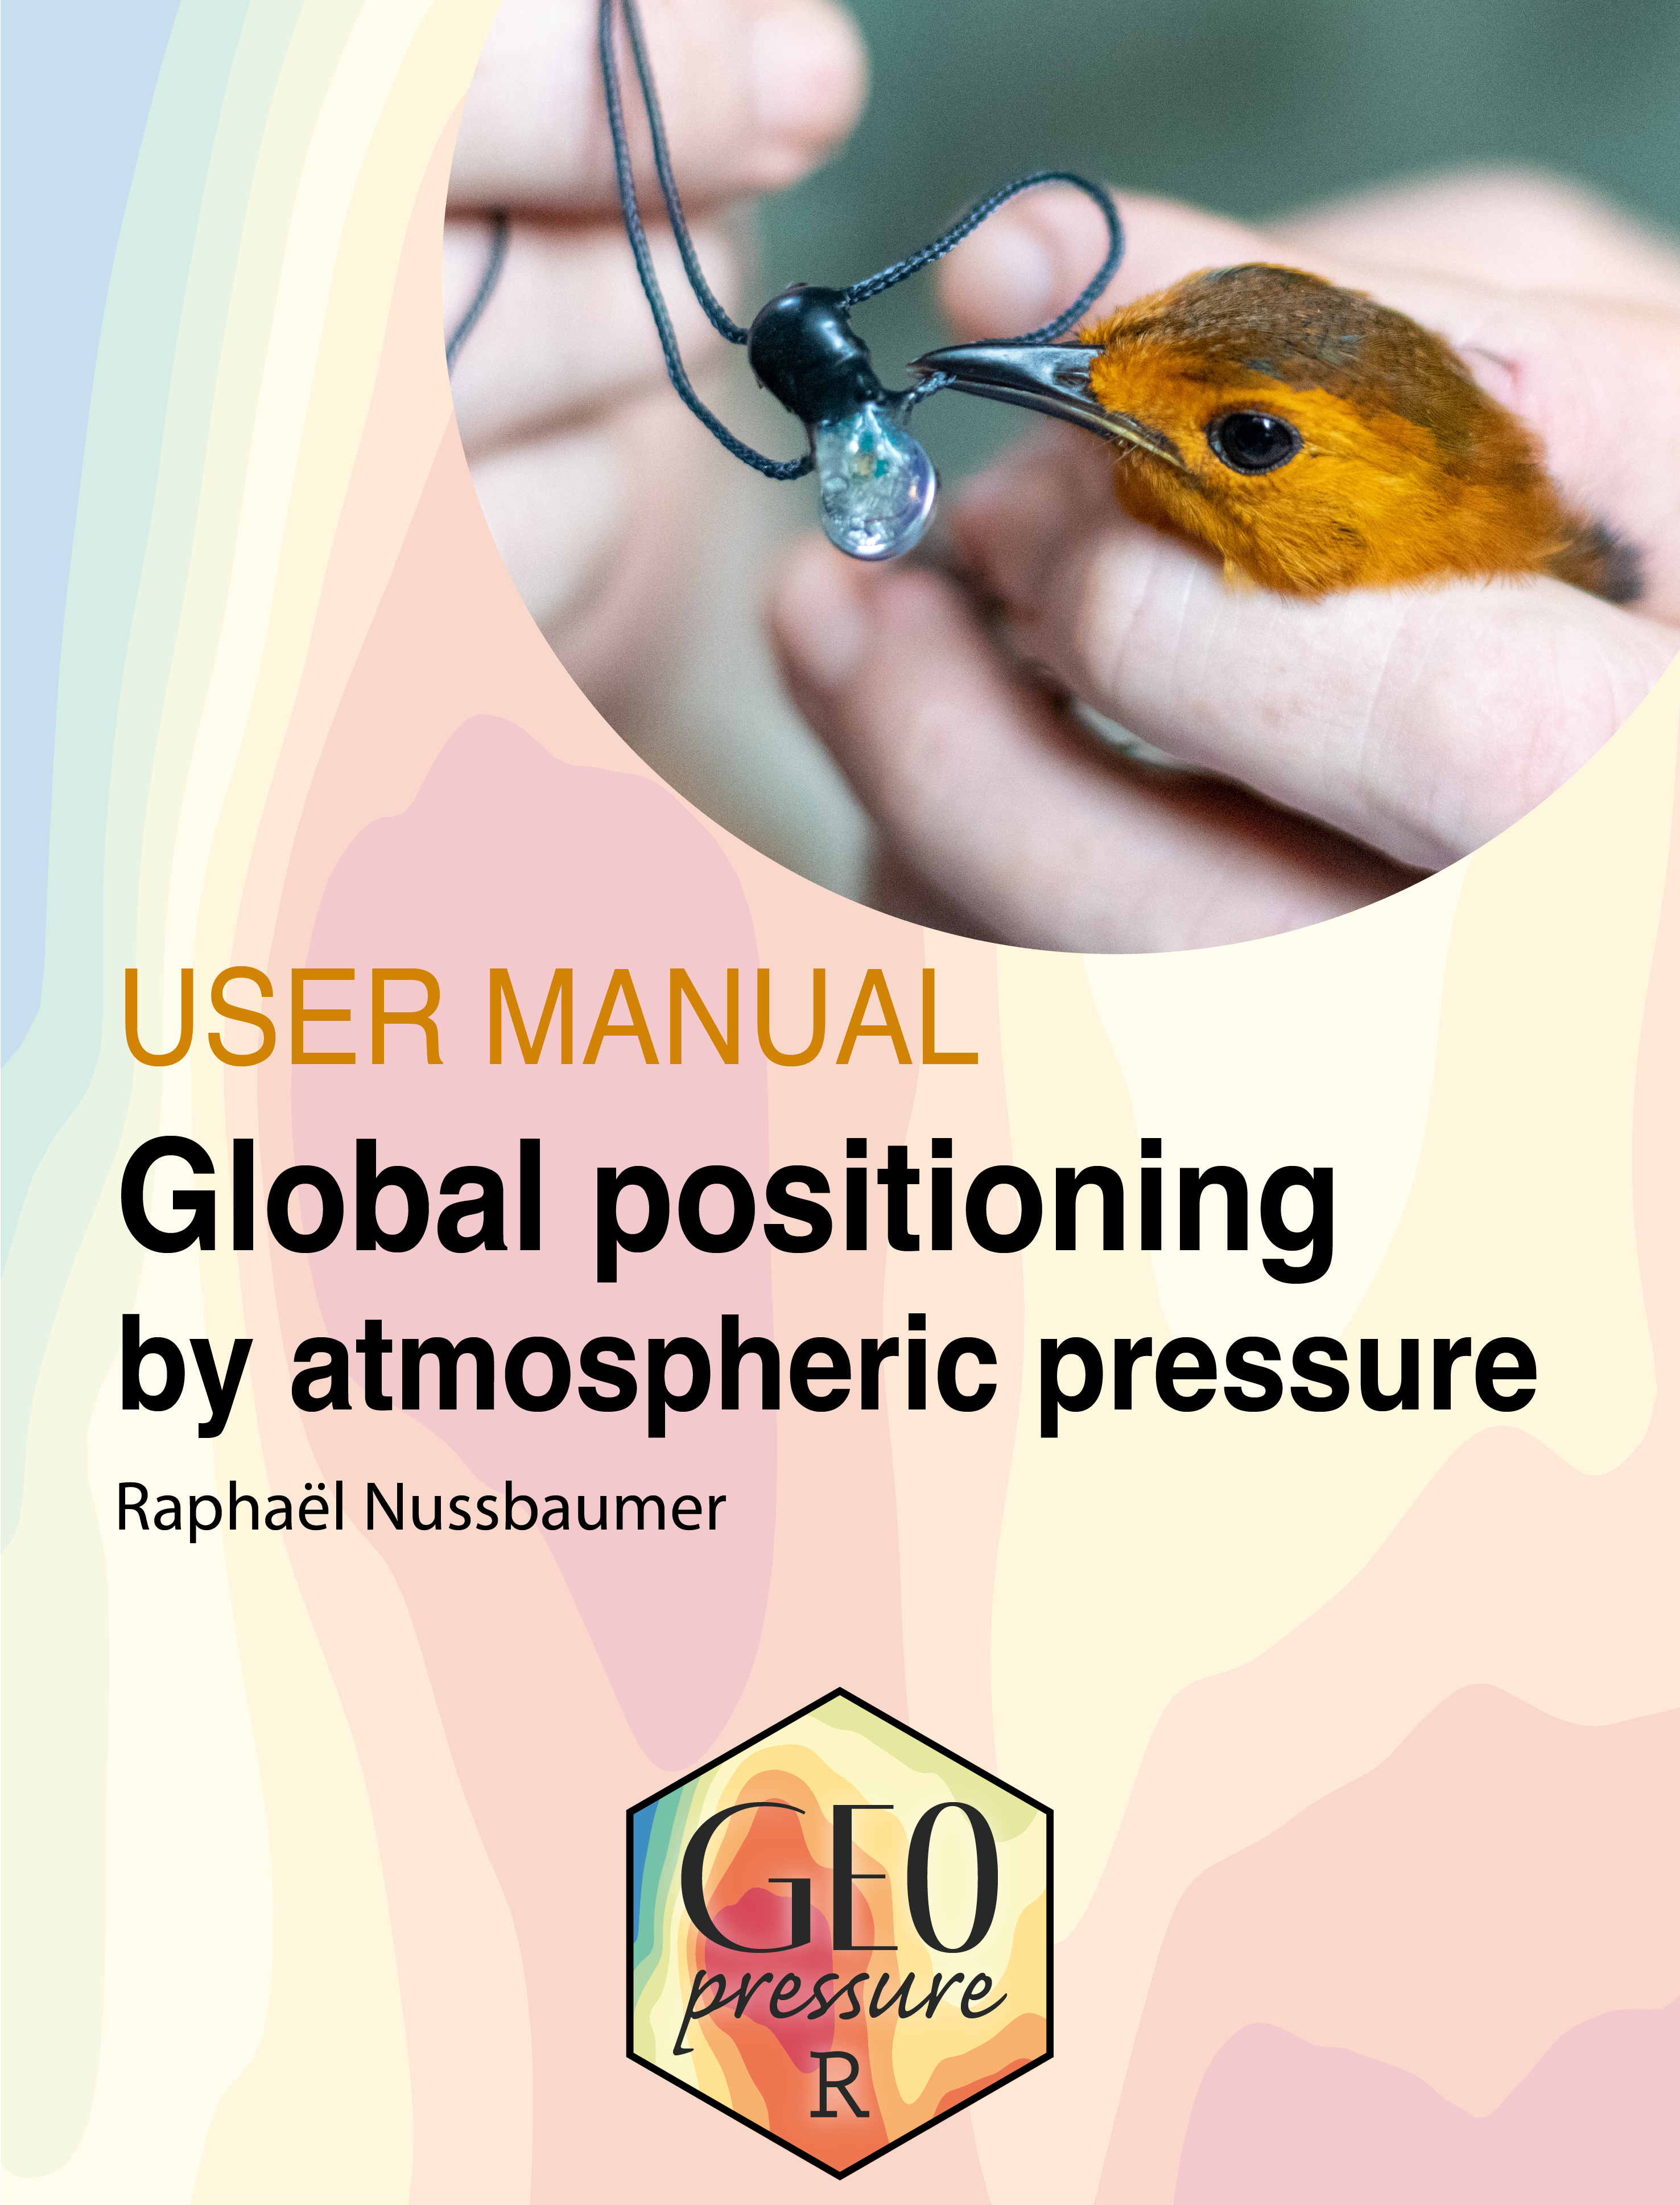
Determining the positions, and over time trajectories, of wildlife is crucial to apprehend ecological relationships in nature. Since satellite devices (e.g. GPS) are too heavy for most bird species, lightweight geolocators remain an essential tool to track bird movement.
Geolocation by pressure provides an exciting opportunity to determine the position of birds with high precision using small tracking devices.
Indeed, as atmospheric pressure varies in space and time, a timeseries of pressure measurement recorded at a single location constitutes a unique signature which can be used for global positioning.
This manual uses GeoPressureR and related tools to apply two methods described in the following papers:
- Nussbaumer, Gravey, Briedis, and Liechti (2023) presents the method to estimate a map of likely positions from a pressure timeseries,
- Nussbaumer, Gravey, Briedis, Liechti, and Sheldon (2023) describes a new approach to reconstruct the full trajectory of a bird quickly and accurately, using pressure and wind data.
For a quick overview of the method, here is a 10 min presentation:
Prerequisites
GeoPressureR is an R package, and this manual assumes basic knowledge of R.
- We recommend installing the latest version of R; GeoPressureR requires at least R
4.1.0. - GeoPressureR works on macOS, Windows, and Linux.
- We recommend using Positron or RStudio Desktop as your editor/IDE.
- An internet connection is required to download ERA5 pressure data during the modelling workflow.
- For trajectory modelling, a computer with 8-16 GB RAM is highly recommended. It can also run on 4 GB RAM, but computations will usually be slower and may require reducing model size.
Data requirements
The only strict requirement is that your geolocator provides a continuous timeseries of pressure (<1hr resolution). Beyond this, here are a few things that can help:
- GeoPressureR works best for species with a clear separation between stationary and migratory periods, as opposed to birds moving continuously over time and/or gradually over large distances (10-50km) or altitude (>10m). As such, aerial feeders such as swifts or bee-eaters or mountainous species do not lend themselves well to this method.
- Acceleration data can be helpful to define the periods of flight, especially if your bird flies at low altitude or if pressure data is measured on a coarse temporal resolution (>15min).
- Light data can accelerate building the trajectory model by allowing to quickly narrow down possible locations during short stationary periods. Generally, for species with few long stopover, light data brings limited benefit, but it can be quite helpful for species with multiple short stopovers, and particularly if migrating on a east/west trajectory.
- Knowing the equipment and retrieval sites can also be helpful, but it also works well without it.
GeoPressureR can currently read Swiss Ornithological Institute (SOI) files (*.pressure, *.glf, *.acceleration), Migrate Technology files (*.deg and *.lux) and Lund CAnMove (*.xlsx).
Feel free to contact me to discuss your data and study species.
The GeoPressure ecosystem
Main analysis
GeoPressureR provides the analysis functions used in this manual and three Shiny apps:
- Trainset labels pressure and acceleration data.
- GeoPressureViz helps inspect trajectories and likelihood maps.
- GeoLightViz labels twilights and tunes light-based geolocation settings.
GeoPressureTemplate provides a ready-made project structure.
GeoPressureAPI lets GeoPressureR compare tag pressure measurements with ERA5 data.
R package extensions
- GeoMagR turns three-axis magnetic measurements into location likelihood maps that can be combined with pressure and light maps in GeoPressureR.
- GeoPathSampleR uses Gibbs sampling and movement priors to reconstruct trajectories from GeoPressureR likelihood maps, including light-only analyses.
Data sharing
- GeoLocator Data Package (DP) defines a standard format for sharing geolocator data.
- GeoLocatoR is an R package for creating and reading these data packages.
- GeoLocatorExplorer is a website for visualizing and exploring published data packages.
Project and community
Explore the project on the GeoPressure website, browse its repositories on GitHub, or ask questions on the GeoPressure forum.
Structure of the manual
This manual includes five parts:
- Basic tutorial runs through the entire workflow using a simple track of pressure only, with the example of a Swainson’s Warbler.
- Advanced tutorial explores additional functionalities of the package using light, acceleration, and wind data, through the example of a Great Reed Warbler.
- Labelling tools introduce labelling, a critical step in the workflow. This is a complex procedure requiring a comprehensive understanding of the method and tools of the package, which is why it is described in more depth after the basic and advanced tutorials. We strongly recommend reading this section attentively for optimal results.
- GeoPressureTemplate defines a standard folder structure to improve readability, sharability, and reproducibility. You’ll learn more about this structure and how to start your own project.
- GeoLocator Data Package is a data exchange format for geolocator data. In this part, you’ll learn how to use the GeoLocatoR package to create a GeoLocator data package.
Feel free to read through the manual, or to fork the repository to run the examples at your own pace.
Installation
The best way to install the GeoPressureR package is through Github:
We can then load the package:
How to cite?
Nussbaumer, R., & Nussbaumer, A. (2024). GeoPressureManual: User Manual for GeoPressureR. Zenodo. https://doi.org/10.5281/zenodo.10799355