8 GeoLightViz
GeoPressureR includes the shiny app GeoLightViz, designed to label twilight data and interactively tune light-based geolocation settings.
It is especially useful when pressure and/or acceleration are not available, because you can define and refine stationary periods directly from twilight patterns.
In practice, GeoLightViz combines four tightly linked tasks:
- interactive twilight quality control,
- manual definition of stationary periods,
- bidirectional time-space exploration between the light plot and map, and
- calibration and likelihood tuning with immediate visual feedback.
8.1 Run GeoLightViz
Start the app with the geolightviz() function using either
geolightviz(tag) # tag object
geolightviz("18LX") #  interim file
geolightviz("data/twilight-label/18LX-labeled.csv") # the label file directly
By default, the app starts in a background R process (run_bg = TRUE), so your console remains available.
See Map tiles to configure optional CARTO, Mapbox, or MapTiler basemaps.
8.2 Label Twilight
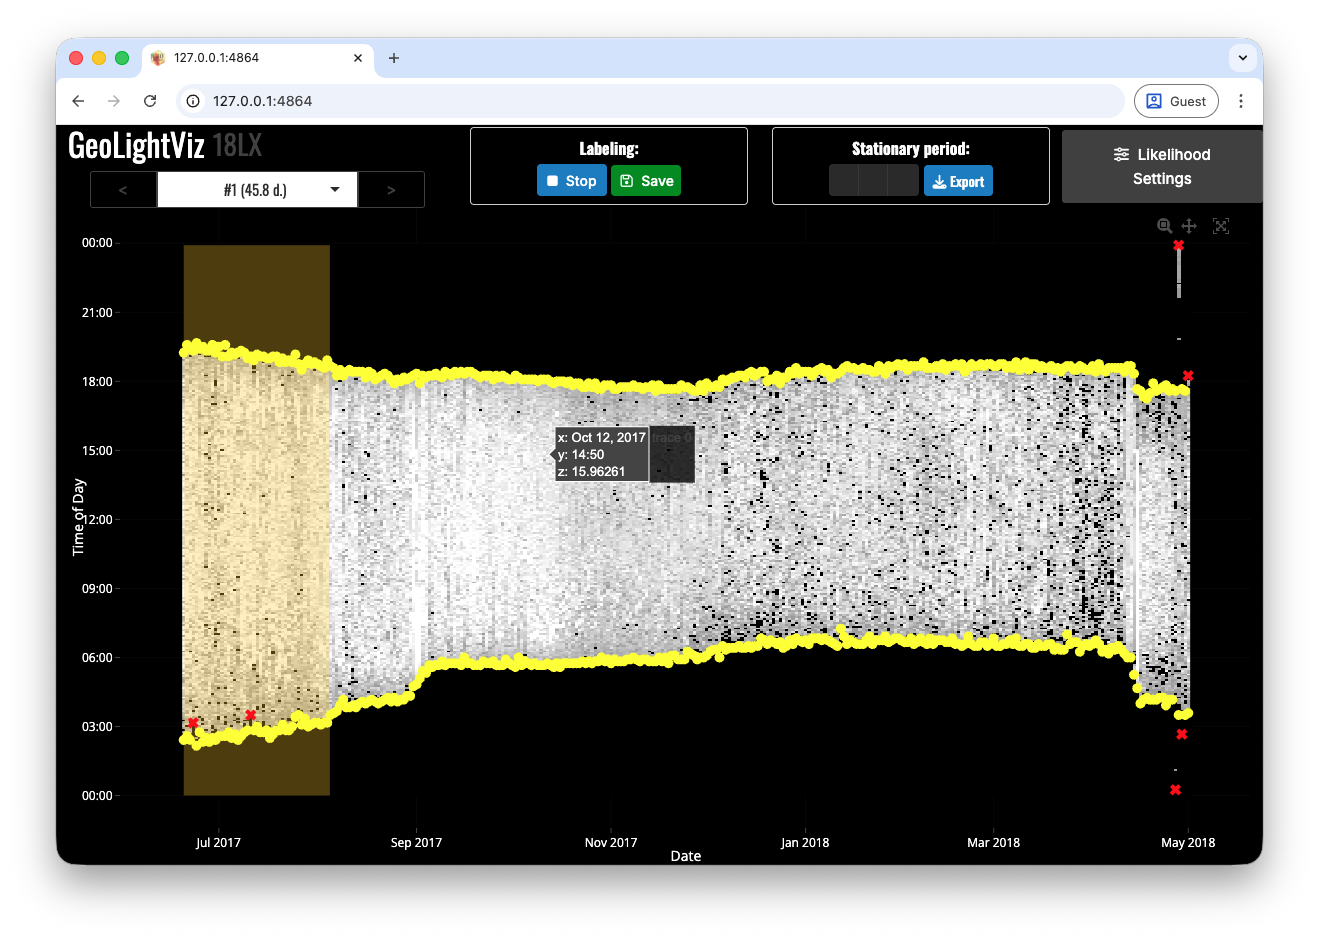
Start with twilight labelling before adjusting map or calibration settings.
The left panel shows the light heatmap and extracted twilights (yellow dots). Outliers caused by shading, cavities, or vegetation can be marked as "discard", and the position estimate for the current stationary period updates immediately so you can distinguish true movement from light-data artefacts.
- Click
Editto enter twilight-labelling mode. - Mark outliers as
"discard"by clicking points individually or drag-selecting multiple points. - Click
Stopwhen finished. - Click
Save(orExport) to write the label file.
When auto-save is available, the output is written to data/twilight-label/{id}-labeled.csv.
8.3 Define Stationary Periods
If pressure/acceleration are unavailable, you can define stap directly in GeoLightViz:
- Use
+to add a stationary period by drawing a time rectangle on the light panel. - Use
pento redraw or resize the range of the currently selected stationary period. - Use
-to remove the current stationary period. - Use the top selector (or
</>) to move across stationary periods and adjust them sequentially. - Click
Save(orExport) to write thestapfile.
When auto-save is available, the output is written to data/stap-label/{id}.csv.
8.4 Map panel
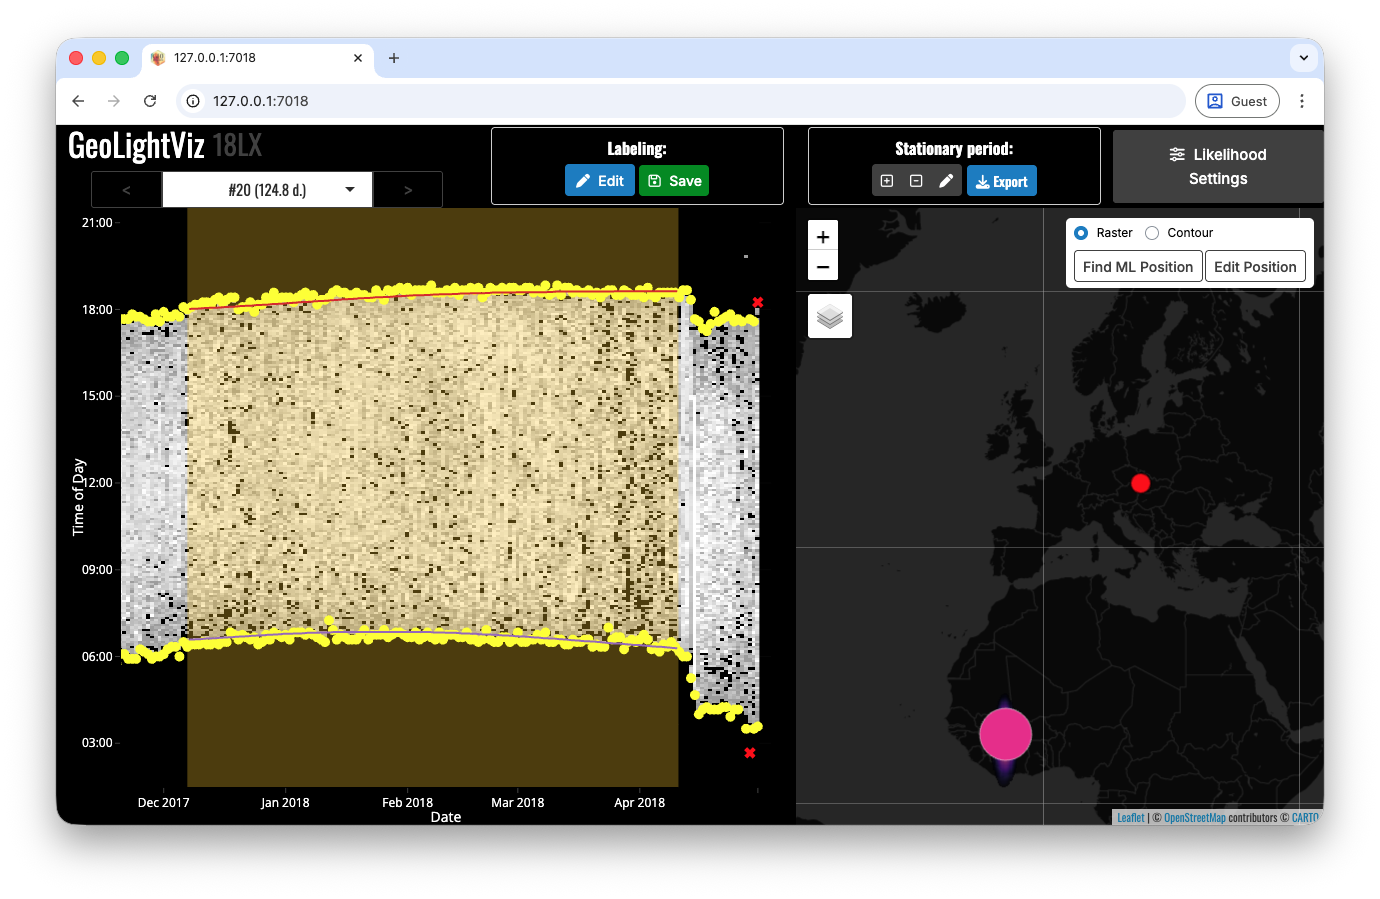
The right map panel is shown only if:
-
tag_set_map()has been run (map extent + scale are defined), and - at least one stationary period is available.
When the map is available, the time and space views are linked:
- Selecting a stationary period updates both the highlighted time window (left) and the corresponding light likelihood map (right).
- Hovering over or selecting a twilight event highlights its corresponding twilight line on the map, making it easier to judge whether a candidate location is consistent with that observation.
-
Edit Positionlets you click on the map to test candidate positions and immediately inspect the implied sunrise/sunset times and twilight lines in the left panel. - This makes quick hypothesis checks possible, for example asking whether the observed twilights are compatible with a location in Spain.
-
Find ML Positionsets the stationary-period location to the maximum-likelihood map position.
8.5 Adjust Twilight Calibration
Open Likelihood Settings to tune the two main light-map components:
-
Calibration smoothness via
twl_calib_adjust, with immediate visual diagnostics of the mismatch between observed and expected twilight timing at known locations. - Twilight aggregation strength (log-linear pooling factor) controlling how strongly multiple twilights are combined within each stationary period.
Together with the map panel, this lets you inspect the full likelihood surface for a stationary period rather than only a single point estimate, which is useful for sensitivity checks before running the full geolight_map_* workflow.
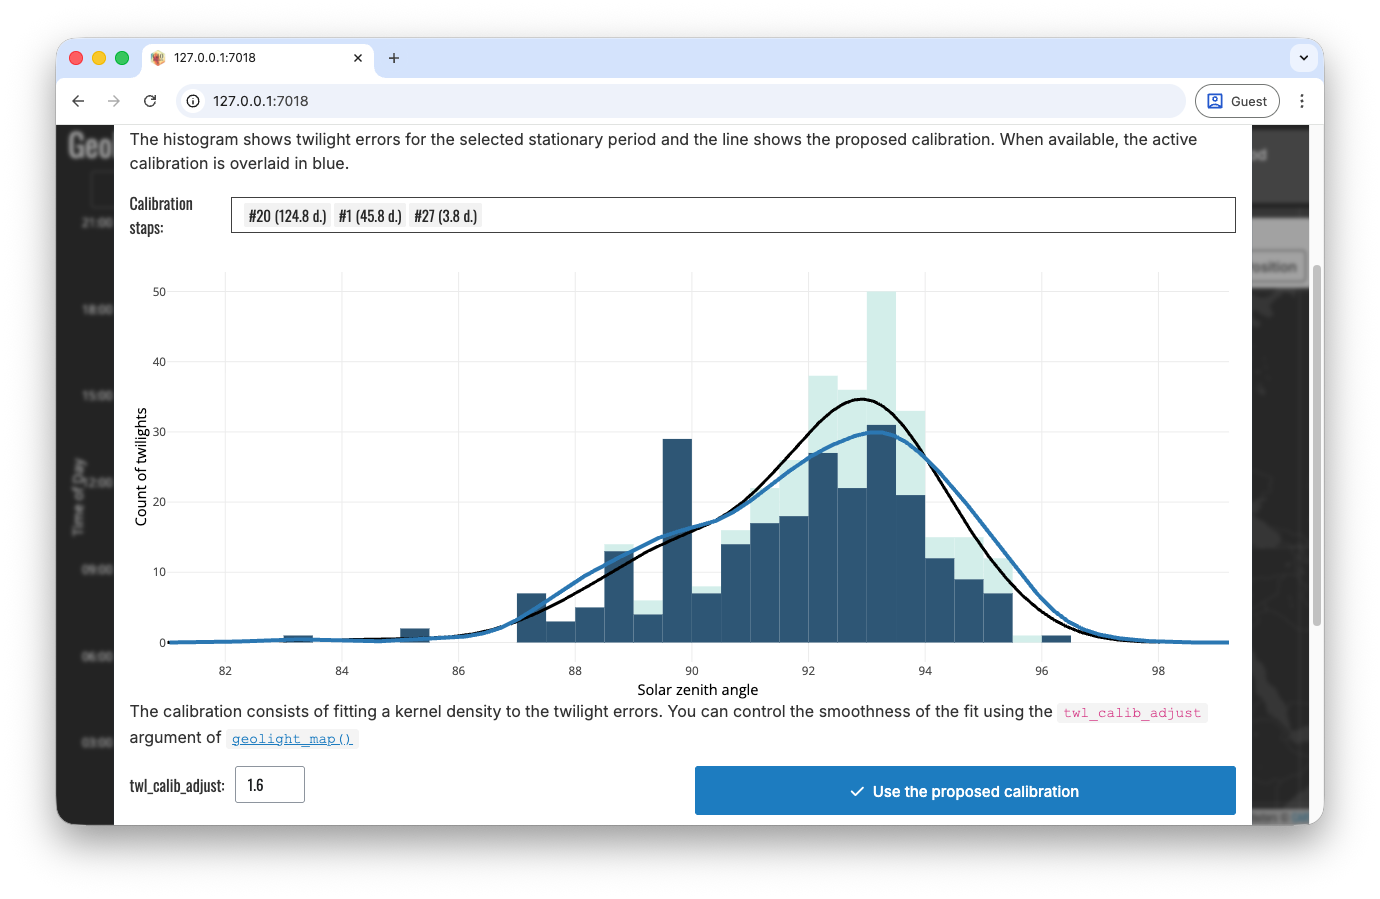
Likelihood Settings modal with calibration diagnostics (twl_calib_adjust) and log-linear pooling controls for map aggregation.