library(GeoPressureR)
library(ggplot2)
library(plotly)6 Pressurepath
In this chapter, we will see what a pressurepath object is and how to use it to compute the altitude of the bird throughout its trajectory.
Let’s load the tag from the Great Reed Warbler (18LX) created in the advanced tutorial.
load_interim("18LX")6.1 Timeseries at a single position
Before creating a full pressurepath, we start with the basic building block of a pressurepath, which is to retrieve the pressure timeseries from ERA5 at a single location with geopressure_timeseries.
geopressure_timeseries returns the timeseries of pressure at a given latitude and longitude. By default (source = "auto"), it reads ECMWF’s ARCO archive when an ECMWF key is set with ecmwfr::wf_set_key(), and otherwise uses the pressure timeseries entry point of GeoPressureAPI.
Let’s start by retrieving the pressure at the known site of equipment, querying the same date as the first stationary period.
ts <- geopressure_timeseries(
lat = tag$stap$known_lat[1],
lon = tag$stap$known_lon[1],
start_time = tag$stap$start[1],
end_time = tag$stap$end[1],
quiet = TRUE
)We can compare the retrieved ERA5 pressure to the pressure measured on the Great Reed Warbler:
p <- ggplot() +
geom_line(data = ts, aes(x = date, y = surface_pressure, colour = "ERA5")) +
geom_line(
data = tag$pressure[tag$pressure$stap_id == 1, ],
aes(x = date, y = value, colour = "tag")
) +
theme_bw() +
ylab("Pressure (hPa)") +
scale_color_manual(values = c("ERA5" = "black", "tag" = "red"))
layout(ggplotly(p), legend = list(orientation = "h"))
TipEureka!
This was the figure that made me realize the potential of pressure measurement to determine birds’ position! The accuracy of the reanalysis data and the precision of the sensor were such that a timeseries of pressure had only a few possible options on the map.
6.2 Pressurepath
NoteWhat is a
pressurepath?
You can think of a pressurepath as the timeseries of pressure that a tag would record on a bird travelling along a specified path. To do that, pressurepath_create() calls geopressure_timeseries() for each stationary period and combines the resulting timeseries of ERA5 pressure.
The pressurepath data.frame returned also contains the original pressure pressure_tag which can be very helpful for labelling and the altitude of the bird corrected for the natural variation of pressure.
pressurepath <- pressurepath_create(
tag,
path = path_most_likely,
quiet = TRUE
)plot_pressurepath(pressurepath)6.3 Altitude above sea level
The main benefit of creating pressurepath is the ability to retrieve ERA5 variables along the trajectory of the bird. One of them is altitude which can be directly plotted with
plot_pressurepath(pressurepath, type = "altitude")
NoteHow is altitude corrected?
Computing the bird altitude \(z_{gl}\) from its pressure measurement \(P_{gl}\) is best performed with the barometric equation
\[ z_{gl}=z_0 + \frac{T_0}{L_b} \left[\left( \frac{P_{gl}}{P_0} \right) ^{-\frac{RL_b}{g M}}-1\right],\]
where \(L_b\) is the standard temperature lapse rate, \(R\) is the universal gas constant, \(g\) is the gravity constant and \(M\) is the molar mass of air.
It is typical to assume a standard atmosphere with fixed \(T_0=15°C\), \(P_0=1013.25 hPa\) and \(z_0=0 m\),
Lb <- -0.0065
R <- 8.31432
g0 <- 9.80665
M <- 0.0289644
T0 <- 273.15 + 15
P0 <- 1013.25
pressurepath$altitude_uncorrected <- T0 /
Lb *
((pressurepath$pressure_tag / P0)^(-R * Lb / g0 / M) - 1)However, we know that pressure and temperature vary considerably over time and space, leading to approximation in the altitude estimated.
GeoPressureR therefore adjusts the barometric equation with the actual ground-level pressure \(P_{ERA5}\), temperature \(T_{ERA5}\) and surface elevation \(z_{ERA5}\) retrieved from ERA5 at the bird’s location \(x\), \[ z_{gl}(x)=z_{ERA5}(x) + \frac{T_{ERA5}(x)}{L_b} \left[\left( \frac{P_{gl}}{P_{ERA5}(x)} \right) ^{-\frac{RL_b}{g M}}-1\right],\]
By default (altitude_formula = "virtual"), \(T_{ERA5}\) is the 2 m virtual temperature, which accounts for humidity, and \(L_b\) is the lapse rate of the GPT3 troposphere model; altitude_formula = "standard" uses the 2 m temperature and the standard lapse rate. ERA5 is read from global ERA5 single levels (era5_dataset = "single-levels", the default), which gives the most accurate altitude. See ?pressurepath_create and the altitude validation for more information.
We can compare these two altitudes for the first stationary period,
The uncorrected altitude estimate incorrectly produces a 200m amplitude error in the altitude due to the natural variation of pressure. In contrast, the corrected altitude shows that the Great Reed Warbler mostly stayed at the same location/altitude during the entire period.
6.4 Altitude above ground level
In order to estimate the flight altitude above ground level, we need to retrieve the ground level elevation along the path. This can be done with path2elevation().
elevation <- path2elevation(
path_most_likely,
scale = tag$param$tag_set_map$scale,
sampling_scale = tag$param$tag_set_map$scale * 2,
percentile = c(10, 50, 90)
)Note that because of the imprecision of the position, particularly during flight, it’s important to analyse with caution the relationship between flight altitude and ground elevation. path2elevation() aggregates the elevation across a larger area defined by scale and returns different percentile values.
6.5 Retrieve ERA5 variables and sunrise along path
pressurepath_create() can also be used to retrieve other ERA5 variables along a path, such as temperature and precipitation. By default, this retrieves data from ERA5-single-levels; use era5_dataset = "land" or "both" to retrieve ERA5-LAND variables. Use pressurepath_variable_available() to list the variables available for each data source. In addition, pressurepath_create() also computes the local sunrise and sunset time along the path using path2twilight().
pressurepath_2_to_5 <- pressurepath_create(
tag,
# in this example we only retrieve these variable between stationary period 2 and 5
path = path_most_likely[
path_most_likely$stap_id >= 2 & path_most_likely$stap_id <= 5,
],
variable = c(
"altitude",
"surface_pressure",
"temperature_2m",
"total_precipitation"
),
solar_dep = -6,
quiet = TRUE
)pressurepath_2_to_5 %>%
mutate(day = date > sunrise & date < sunset) %>%
ggplot(aes(x = date, y = temperature_2m, colour = day)) +
geom_point()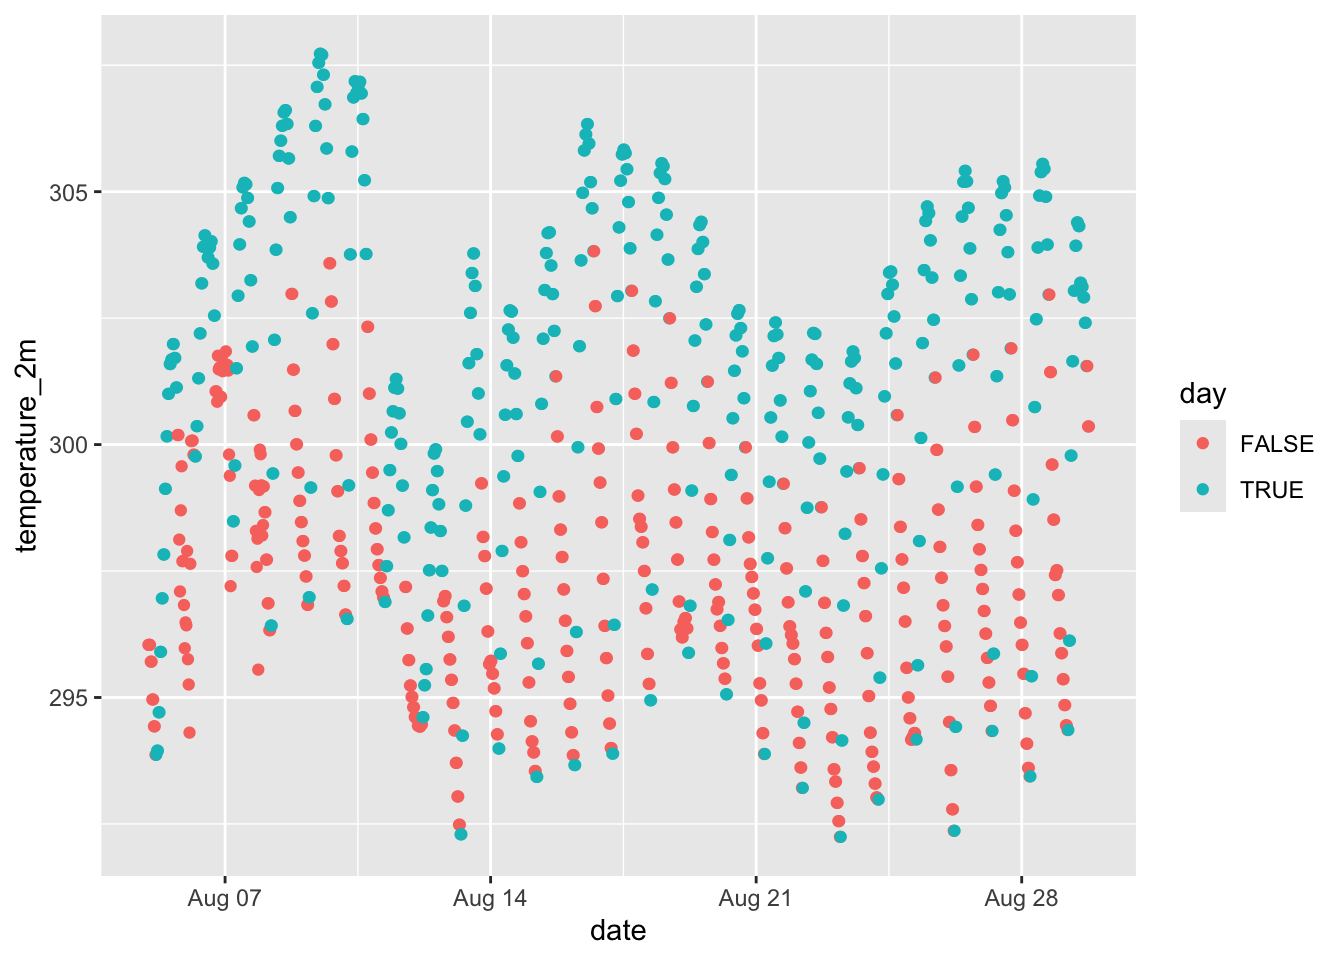
6.6 Save
param <- graph$param
save(
param,
tag,
graph,
path_most_likely,
path_simulation,
marginal,
edge_simulation,
edge_most_likely,
pressurepath,
file = "./data/interim/18LX.RData"
)